planAnalytics = Fiduciary Performance
dailyVest’s planAnalytics empowers business users to make information-driven decisions that positively effects plan participation and performance. planAnalytics includes data acquisition and discovery, data integration and data mining capabilities, all in a scalable, flexible, secure and easy to manage business analytics module.
planAnalytics provides a web-based interface for business users -- plan sponsors and administrators -- to access any plan data they wish to see or use in reporting. The Home page provides a convenient place to access key plan metrics such as participation, investment, asset and money type allocation, plan and individual fund performance, and investment activity.
Plan Overview
Tap or hover numbered sections for more information.
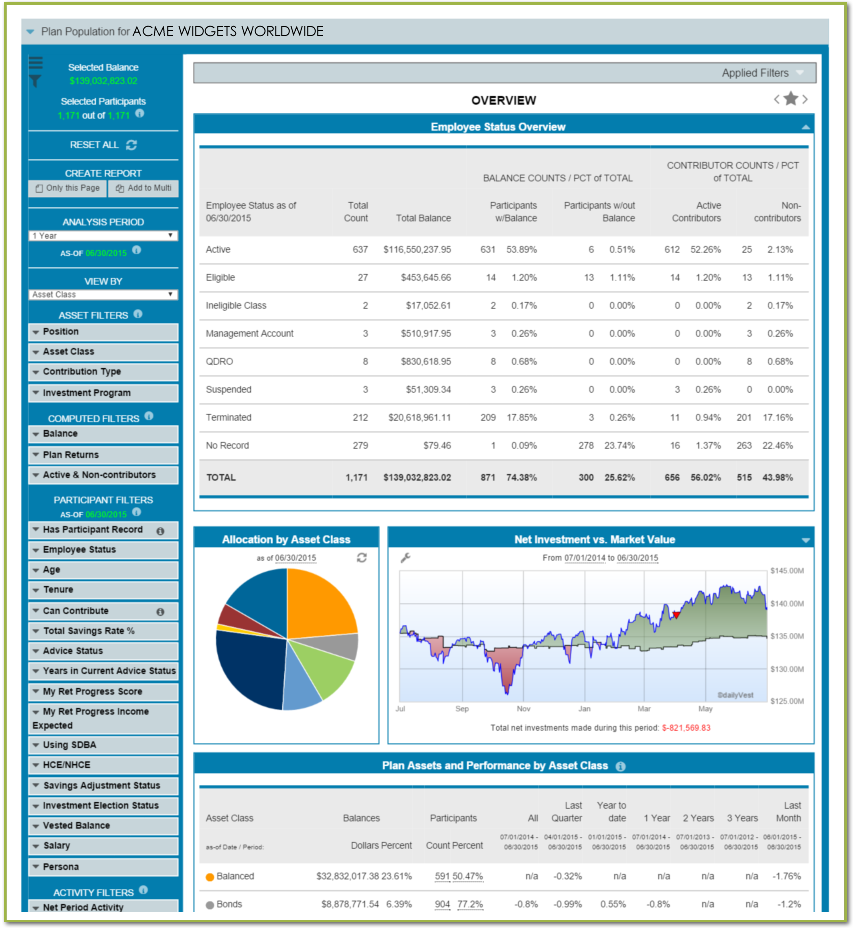
Expandable participant GRID contains details about each employee.
Select & drill-down to any group of participants using panel of FILTERS.
Employee status at a glance.
Plan's net investments vs market value show cash flows over time.
Table legend and pie show valuations and performance by fund, source & asset class.
Participant Grid
Grid contains participant attributes or 'census data' specified by your firm and supplied by your recordkeeping system.
Tap or hover numbered sections for more information.
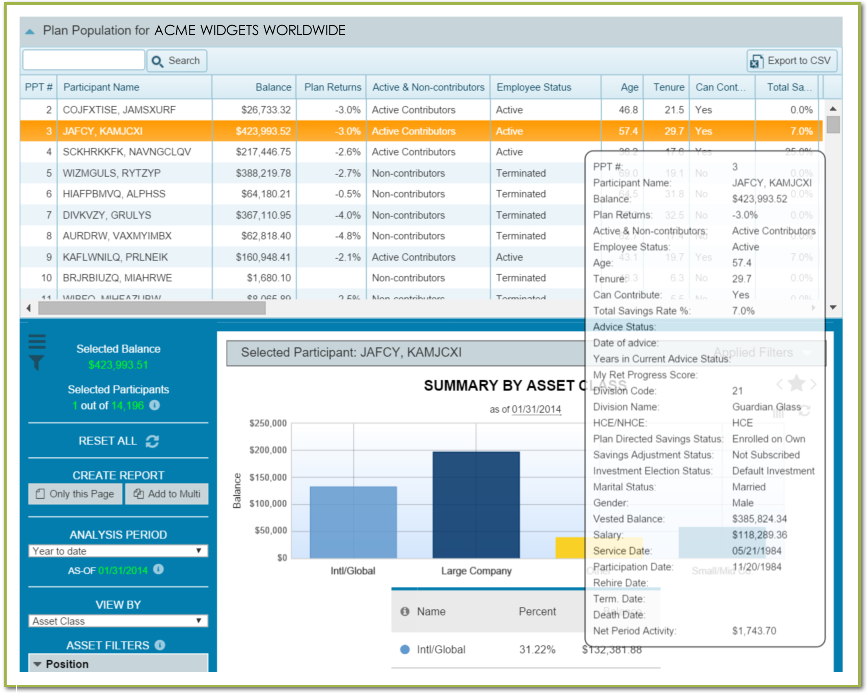
Select individual employees and hover for details.
All analytics work at participant- and plan-level.
Plan Participation Rate
Some charts within planAnalytics require very little filter manipulations to create powerful and important plan views.
Tap or hover numbered sections for more information.
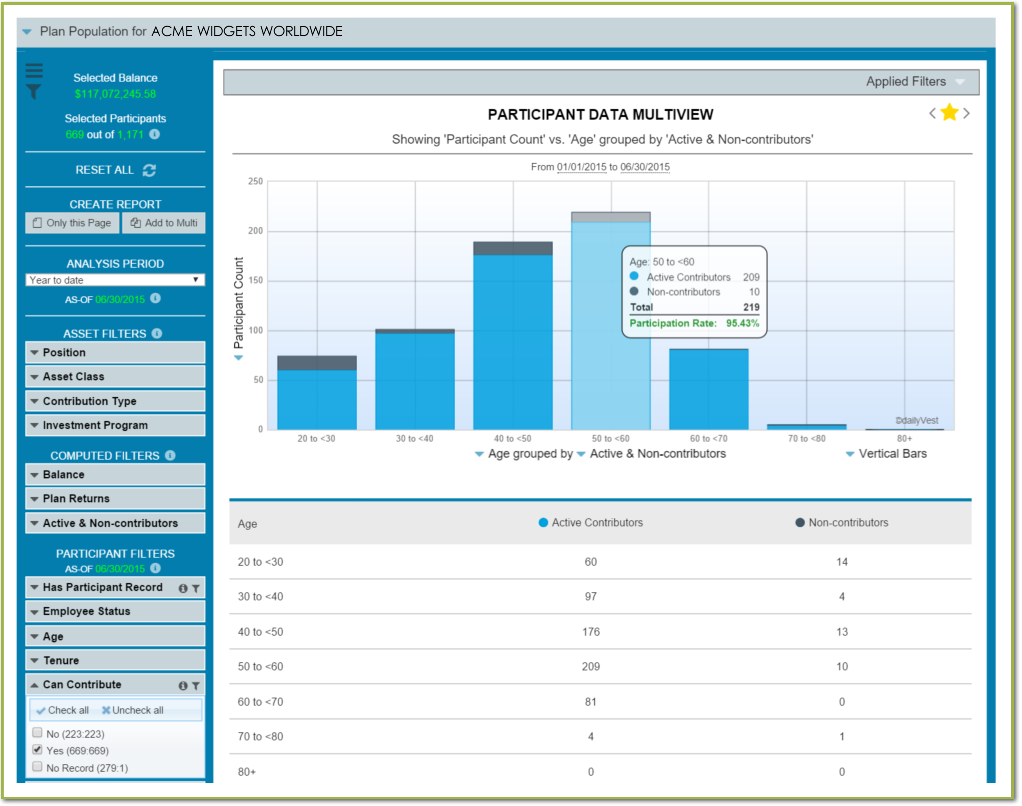
Expand the grid and quickly find participants not contributing.
Chart shows plan participation rates by Age group.
Use the filter panel to select participants who can contribute.
Employee Status Overview
This table provides useful balance and counts for each employee status, and breaks that down further showing counts with and without a balance and those who are and are not active contributors.
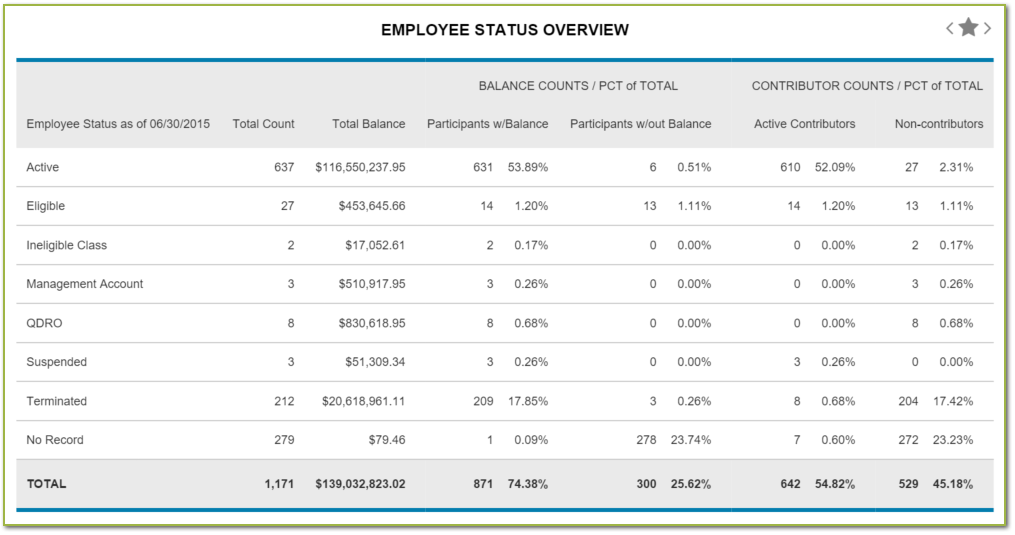
The star in the upper right of each view is a 'Favorites' marker.
Participant Filtering
This sequence demonstrates how filtering by participant attributes can be used to select and identify employees possibly needing additional education and outreach.
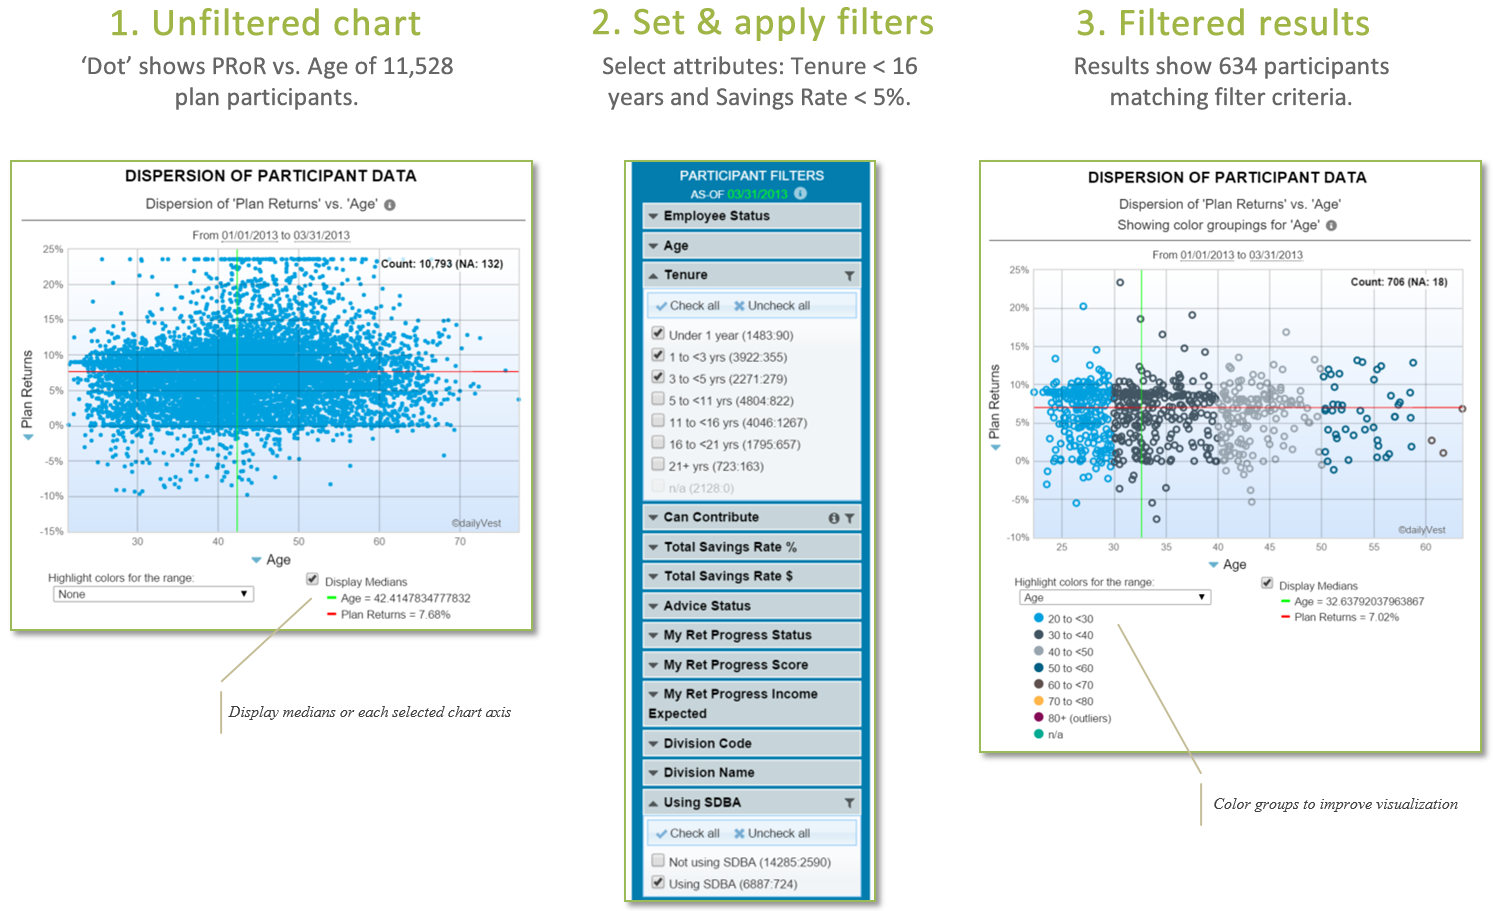
1. Start with everyone in the plan
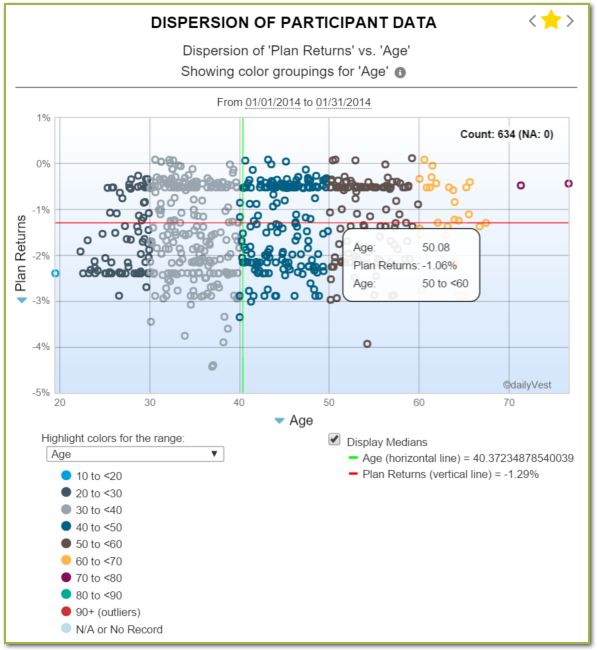
This 'unfiltered' chart shows a ‘dot’ for the personal rate-of-return vs. age of each participant having a return in the plan… 11,528 in all!
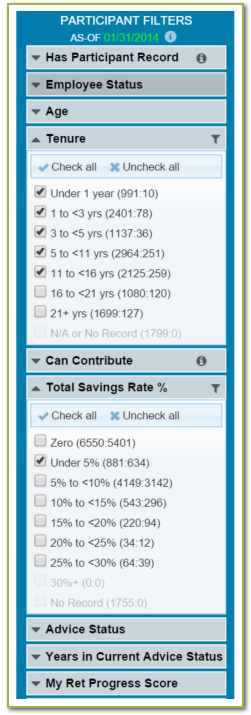
2. Set & apply filters using Filters Panel
Apply participant attribute filters; e.g: Tenure < 16 years and Savings Rate under 5%.
3. View filtered participants
Results show personal rate-of-return for only those matching given criteria grouped by age… now 706!
Filtering is available on almost all screens and allows you to analyze only those plan participants with specific investment or participation criteria you are looking for.
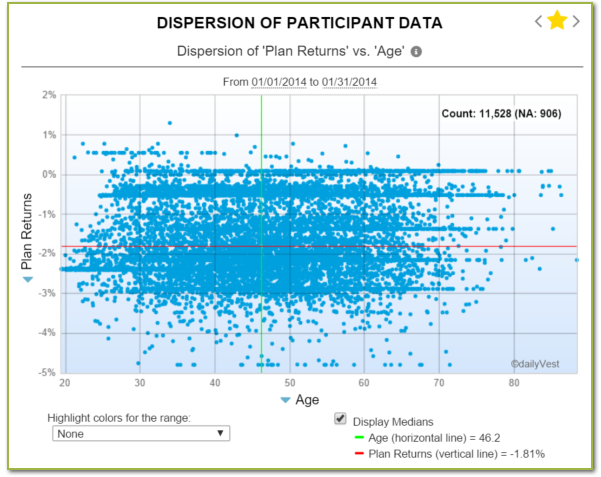
Ranges of Participant Data
High, Median, Low. This chart shows high, median and low personal rates of return achieved by all participants in the plan, grouped by age.
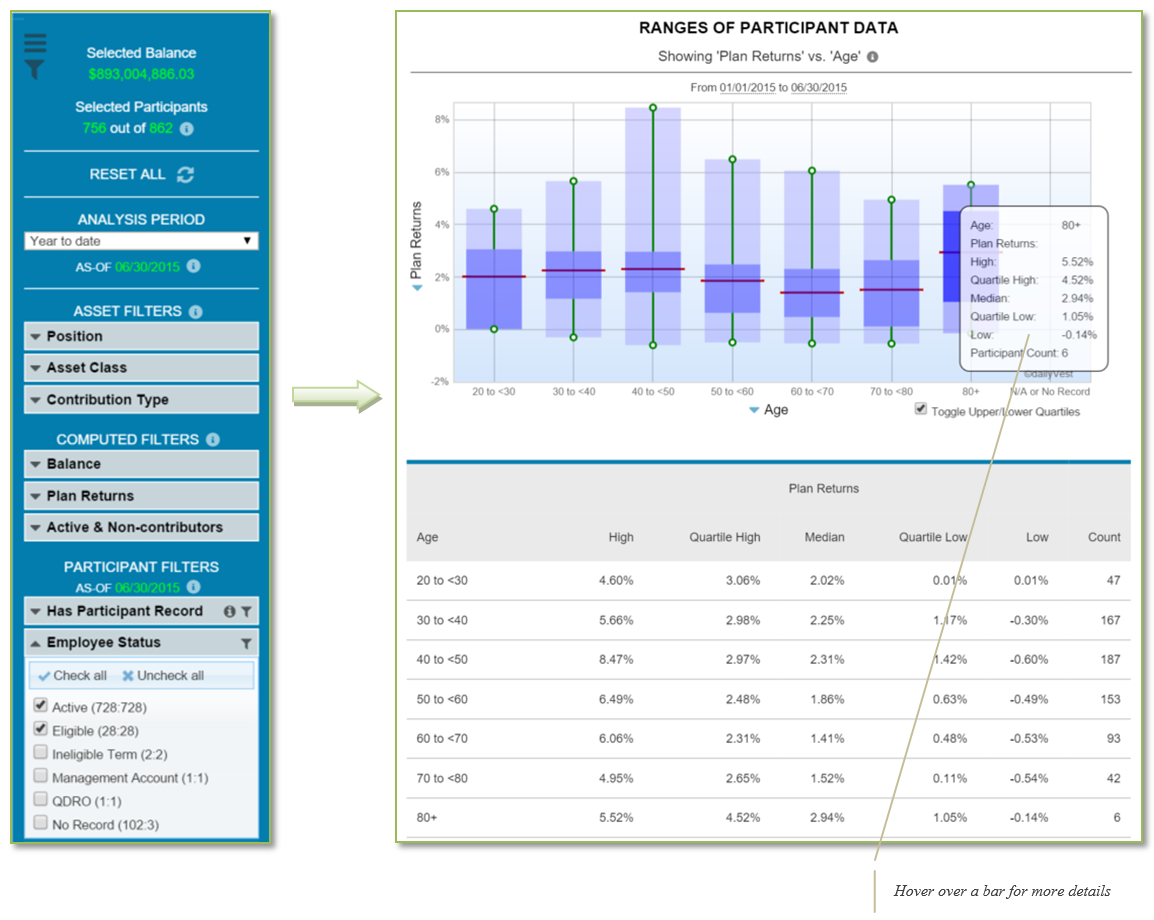
Investment returns for participants nearing retirement should be on the conservative side. To investigate, set a filter to view personal rates of return for Active and Eligible participants.
Plan & Participant-level Cash Flows
- 1
Analyze at plan level or individual participant
- 2
View by Asset Class, Fund or Source/Money-type
- 3
Click on table column headers to sort
- 4
Shows details about each cash flow type on hover
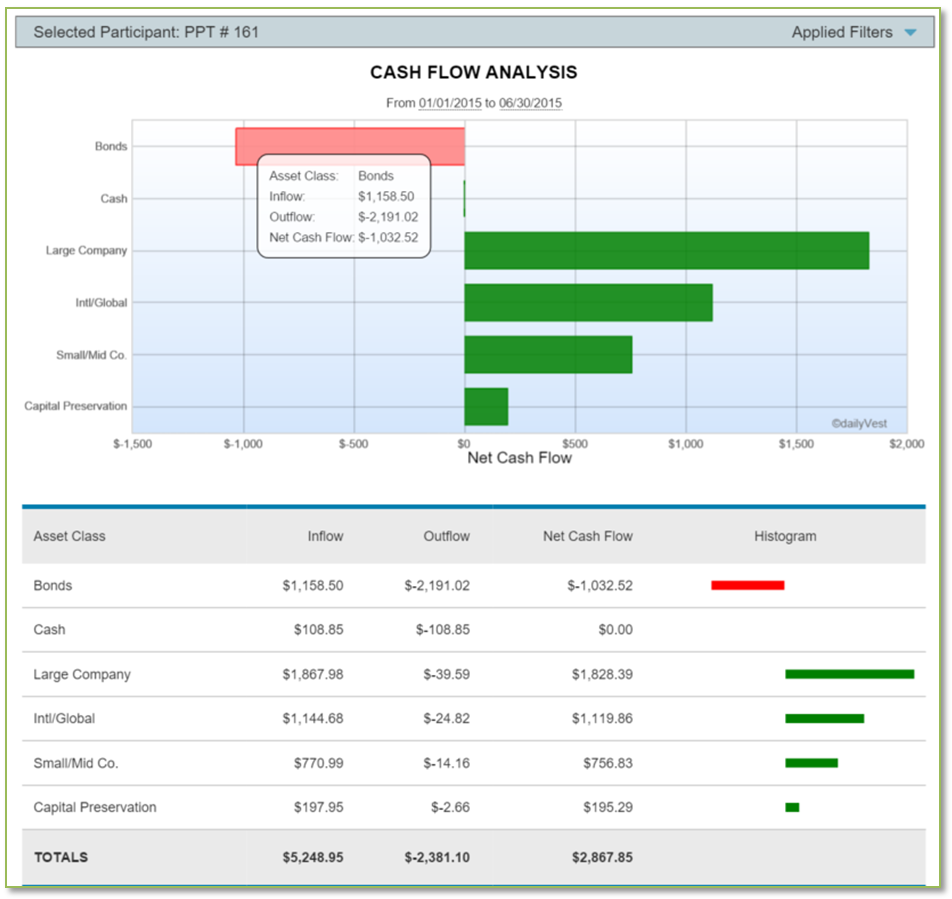
This chart was rendered at the participant-level. Unselecting that participant regenerates the analysis at a plan level.
Plan & Participant-level Activity Trends
This chart showing periodic activity summary keeps track of fees, withdrawals, contributions and other activity each week, month or year -- all at the plan or participant-level.
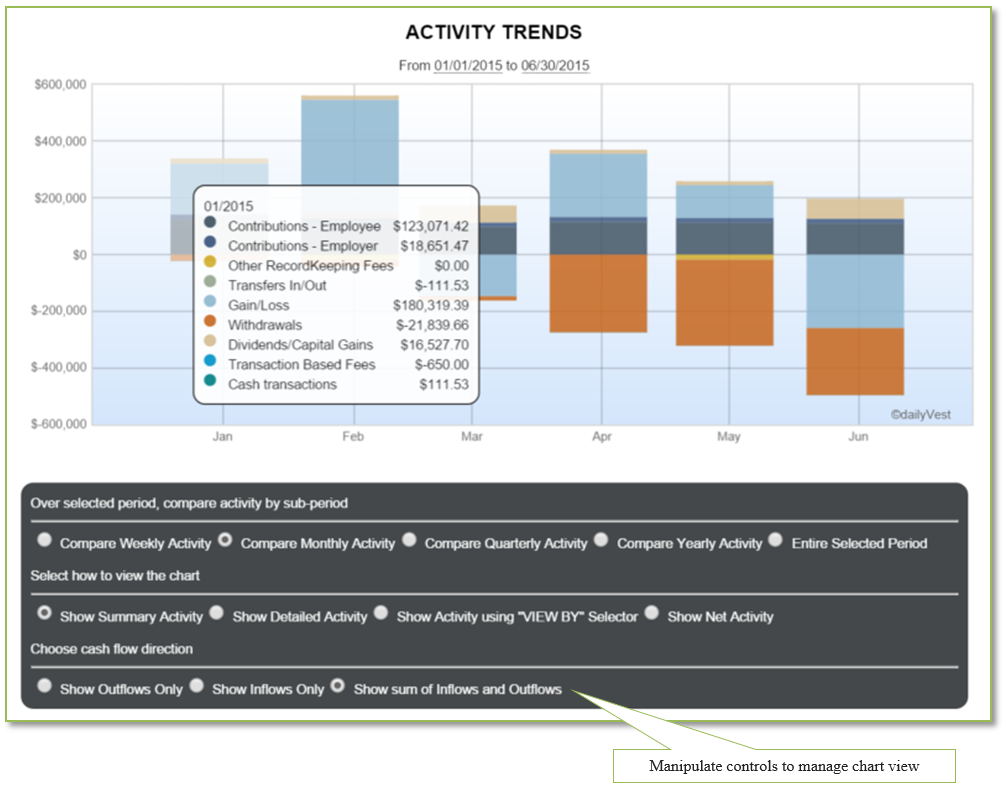
This chart shows the monthly summary of plan activity.
Detailed Investment Activity
planAnalytics contains superior investment analysis. View detailed investment activity by fund, asset class and money-type/source using this table.
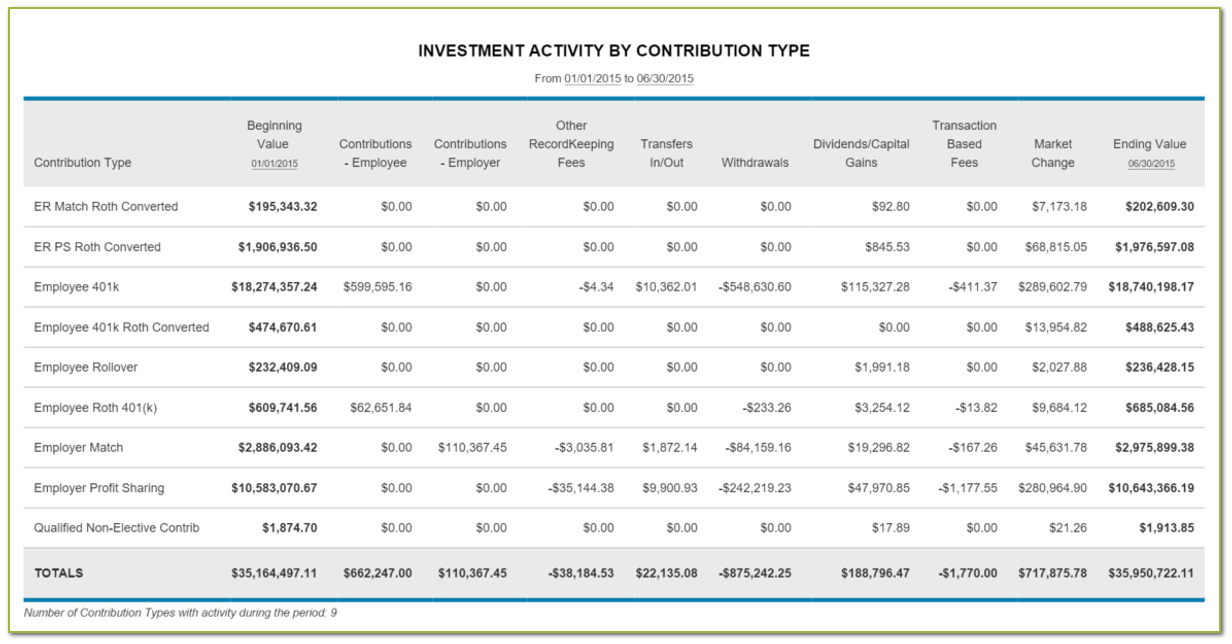
Using filtering, this same tabular activity can be generated for a single participant or a group of participants.
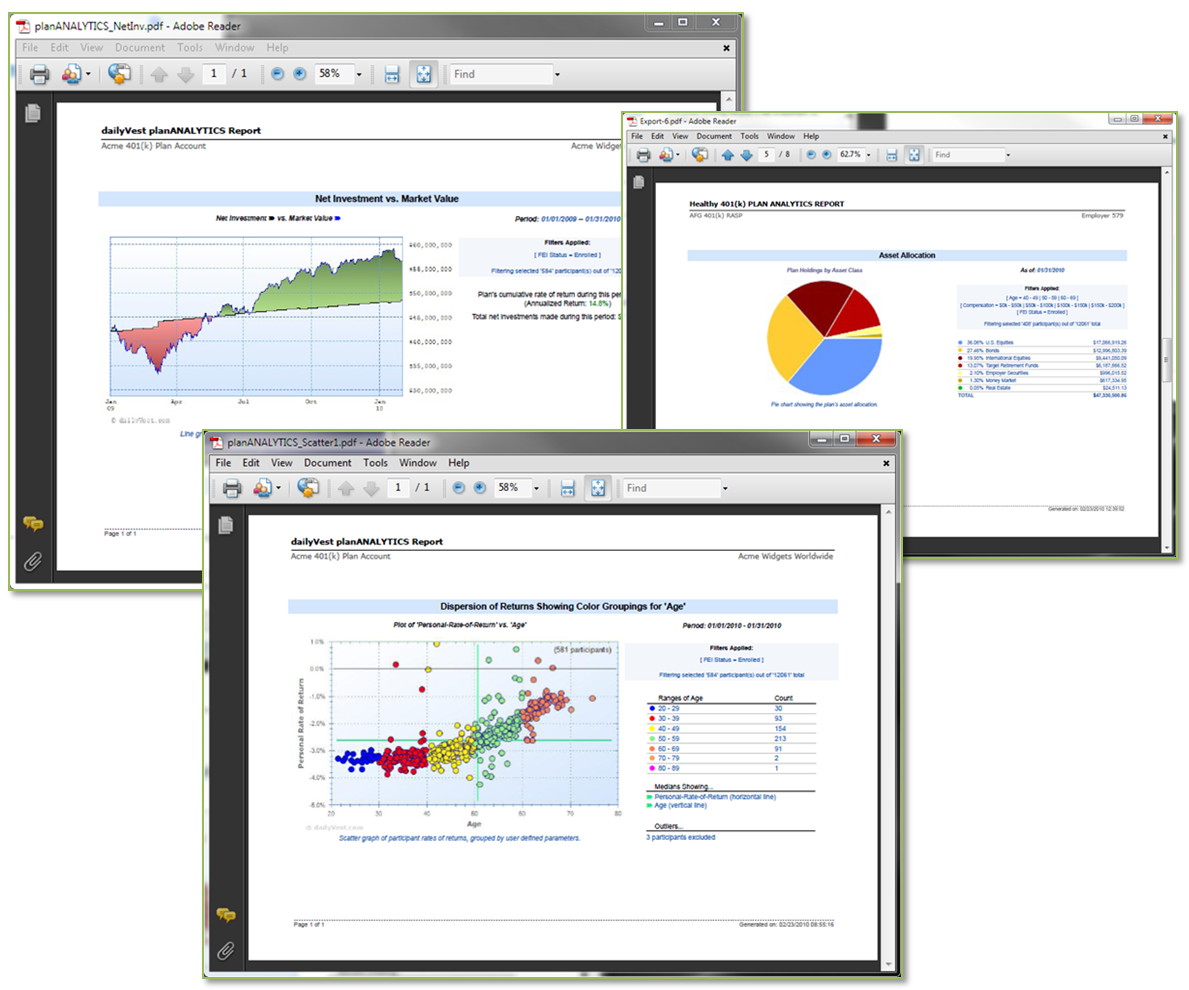
Reporting Capability
Report pages can be generated separately or as part of a multi-analytic report package. In addition, much of the data generated by planAnalytics can be exported to Excel spreadsheets.